¶ Introduction
The goal of this guide is to achieve a complete monitoring of your Linky energy meter with a Raspberry, a teleinfo module and the information plugs of your energy meter.
Here, we have a Raspberry Pi 2 model B, however it will work on any Linux or BSD with some tuning.
This should work on any european energy meter with L1/L2 plugs, not only the Linky.
¶ Hardware needed
You must have:
- A raspberry with a good SD card
- A serial module, I use this: https://www.tindie.com/products/hallard/micro-teleinfo-v20/
- Two copper cables (I use 1,5mm2)
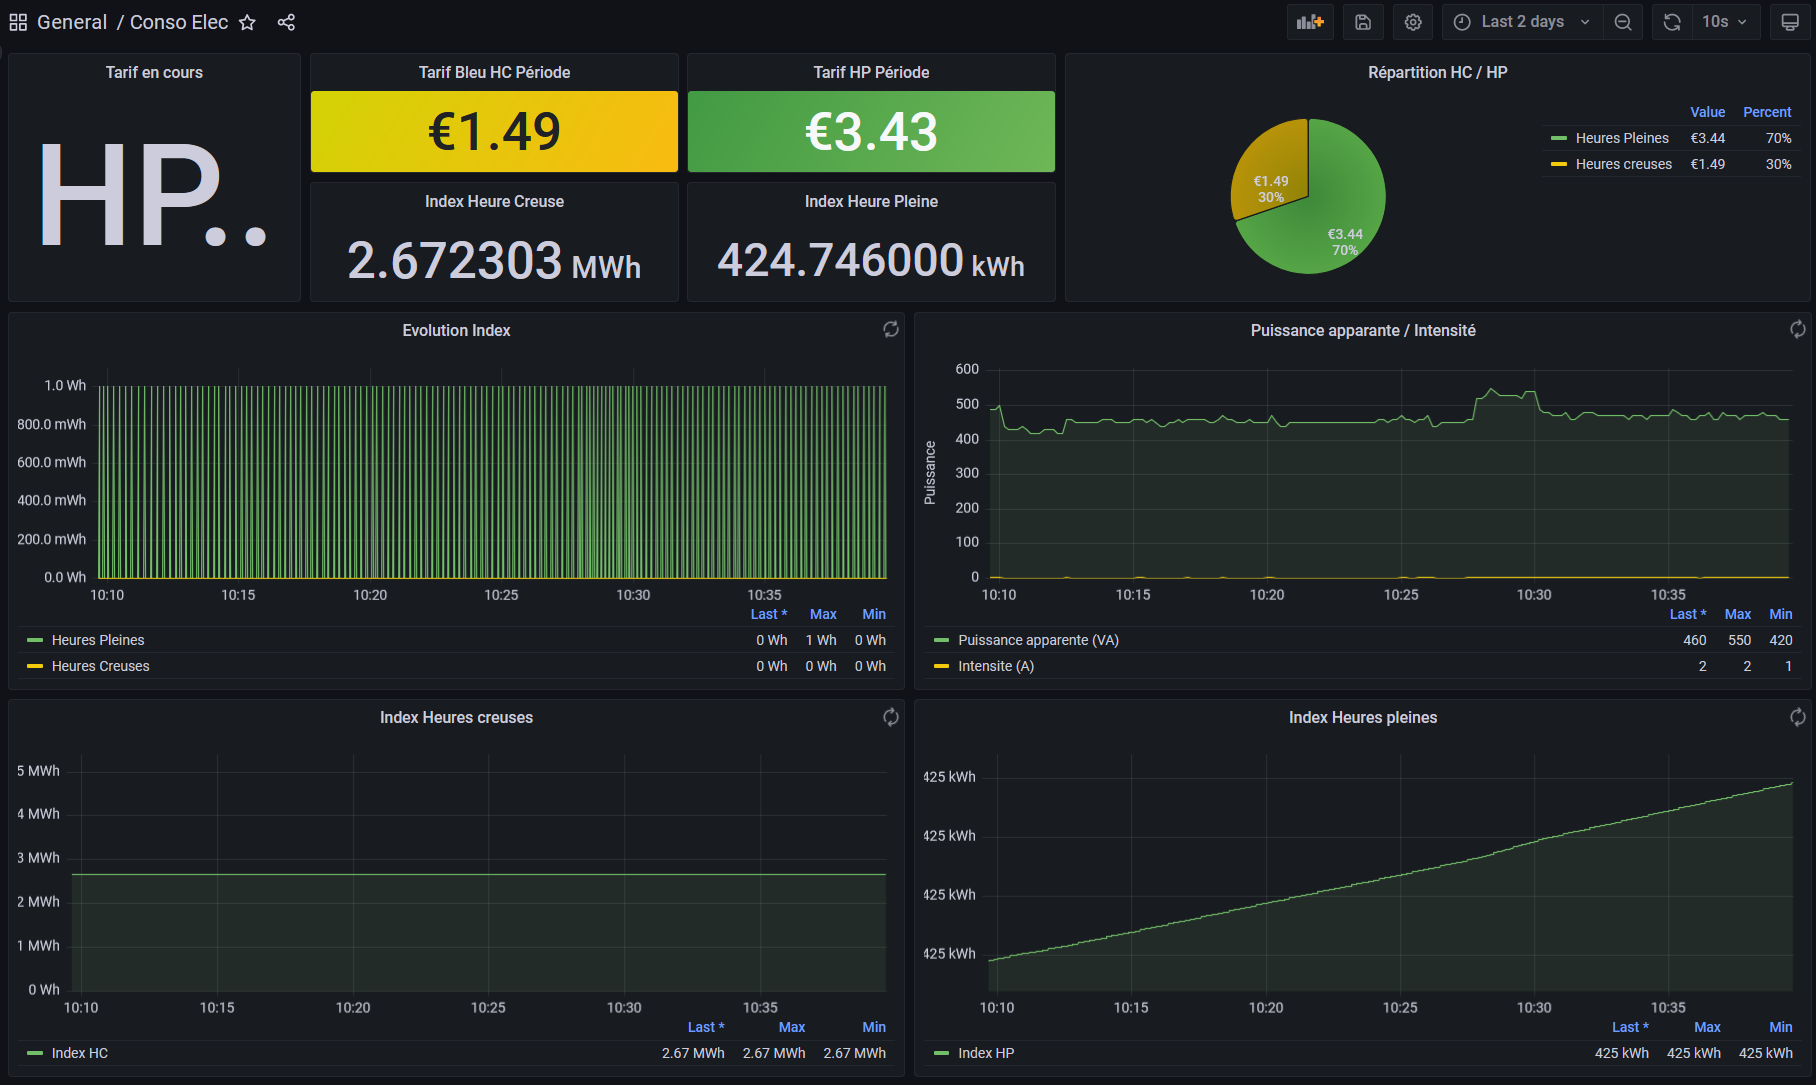
At the end, you will have this kind of Grafana Dashboard:
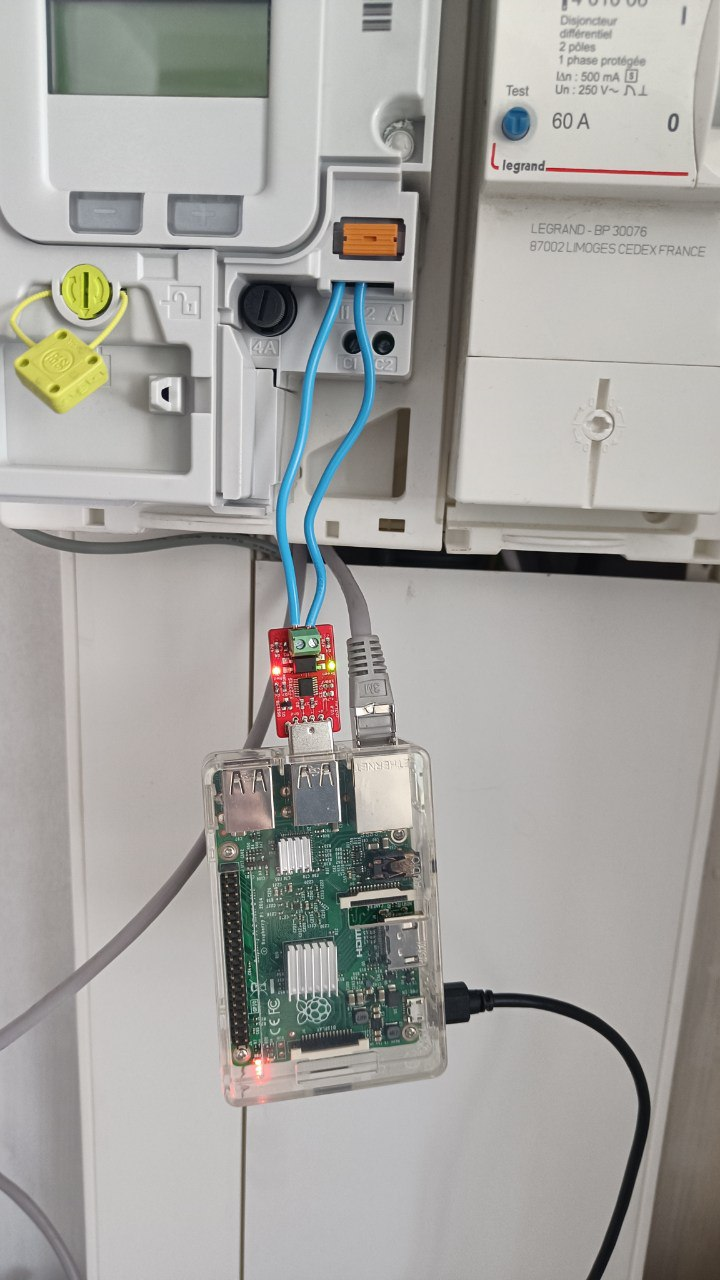
¶ Connecting the system
You need to set up the system like this (you can invert L1 and L2, it doesn't matter):
¶ Configuring the system
¶ Configuring InfluxDB
Configure the InfluxDB repository:
curl https://repos.influxdata.com/influxdb.key | gpg --dearmor | sudo tee /usr/share/keyrings/influxdb-archive-keyring.gpg
echo "deb https://repos.influxdata.com/debian $(lsb_release -cs) stable" > /etc/apt/sources.list.d/influxdb.list
Install the database:
apt update && apt install influxdb
Enable the service and start InfluxDB:
systemctl enable influxdb && systemctl start influxdb
¶ Configuring Grafana
Configure the Grafana repository:
wget -q -O - https://packages.grafana.com/gpg.key | sudo apt-key add -
echo "deb https://packages.grafana.com/oss/deb stable main" > /etc/apt/sources.list.d/grafana.list
Install Grafana:
apt update && apt install grafana
Enable and start Grafana:
systemctl enable grafana-server && systemctl start grafana-server
¶ Installing the Python script to retrieve the data
Test your serial connection with this command (You can exit with CTRL+A followed by CTRL+Q):
picocom -b 1200 -d 7 -p e -f n /dev/ttyUSB0
You should have something like this:
root@enedis-pi:~# picocom -b 1200 -d 7 -p e -f n /dev/ttyUSB0
picocom v3.1

port is        : /dev/ttyUSB0
flowcontrol    : none
baudrate is    : 1200
parity is      : even
databits are   : 7
stopbits are   : 1
escape is      : C-a
local echo is  : no
noinit is      : no
noreset is     : no
hangup is      : no
nolock is      : no
send_cmd is    : sz -vv
receive_cmd is : rz -vv -E
imap is        :
omap is        :
emap is        : crcrlf,delbs,
logfile is     : none
initstring     : none
exit_after is  : not set
exit is        : no

Type [C-a] [C-h] to see available commands
Terminal ready
0440 )
HHPHC A ,
TDETAT 000000 B
  ADCO 812164547605 H
OPTARIF HC.. <
ISOUSC 45 ?
HCHC 002669308 (
HCHP 000418037 *
PTEC HP..
IINST 001 X
IMAX 090 H
PAPP 00440 )
HHPHC A ,
TDETAT 000000 B
  ADCO 812164547605 H
OPTARIF HC.. <
ISOUSC 45 ?
HCHC 002669308 (
HCHP 000418037 *
PTEC HP..
IINST 001 X
IMAX 090 H
PAPP 00440 )
HHPHC A ,
TDETAT 000000 B
  ADCO 812164547605 H
OPTARIF
Terminating...
Skipping tty reset...
Thanks for using picocom
Install the prerequisites:
apt install python3-pip
pip3 install pySerial influxdb
Or on the latest Debian 13:
apt installpython3-serial python3-influxdb
Download and launch the script to test it:
wget https://raw.githubusercontent.com/stylersnico/teleinfo-linky-with-raspberry/master/teleinfo.py
python3 teleinfo.py
If you don't experience any error in 5 minutes, exit with CTRL+C.
¶ Checking the data
Launch Influx to check if the data has been created:
influx
Connect to teleinfo and show the series:
USE teleinfo
SHOW SERIES;
You should have something like this:
Connected to http://localhost:8086 version 1.8.10
InfluxDB shell version: 1.8.10
> USE teleinfo
Using database teleinfo
> SHOW SERIES;
key
---
HCHC,host=raspberry,region=linky
HCHP,host=raspberry,region=linky
HHPHC,host=raspberry,region=linky
IINST,host=raspberry,region=linky
IMAX,host=raspberry,region=linky
ISOUSC,host=raspberry,region=linky
MOTDETAT,host=raspberry,region=linky
OPTARIF,host=raspberry,region=linky
PAPP,host=raspberry,region=linky
PTEC,host=raspberry,region=linky
> exit
root@enedis-pi:~#
¶ Creating the service
Create the following service:
nano /etc/systemd/system/teleinfo.service
Fill the file like this:
[Unit]
Description = Run teleinfo python script
After = network.target

[Service]
Type = simple
ExecStart = python /root/teleinfo.py
User = root
Group = root
Restart = on-failure
SyslogIdentifier = teleinfo
RestartSec = 5
TimeoutStartSec = infinity

[Install]
WantedBy = multi-user.target
Now, enable and launch the service:
systemctl daemon-reload
systemctl enable teleinfo.service && systemctl start teleinfo.service
¶ Configuring the display
¶ Configuring InfluxDB source in Grafana
Open Grafana from the following URL:
http://IP_RASPBERRY:3000
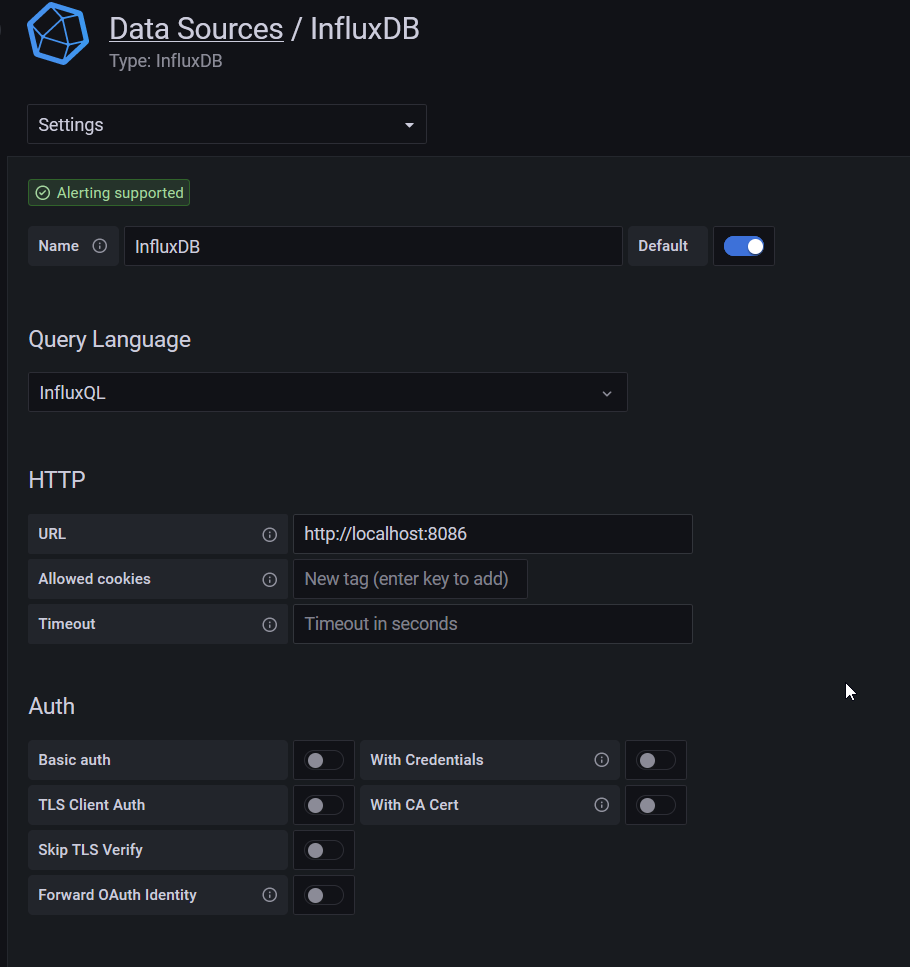
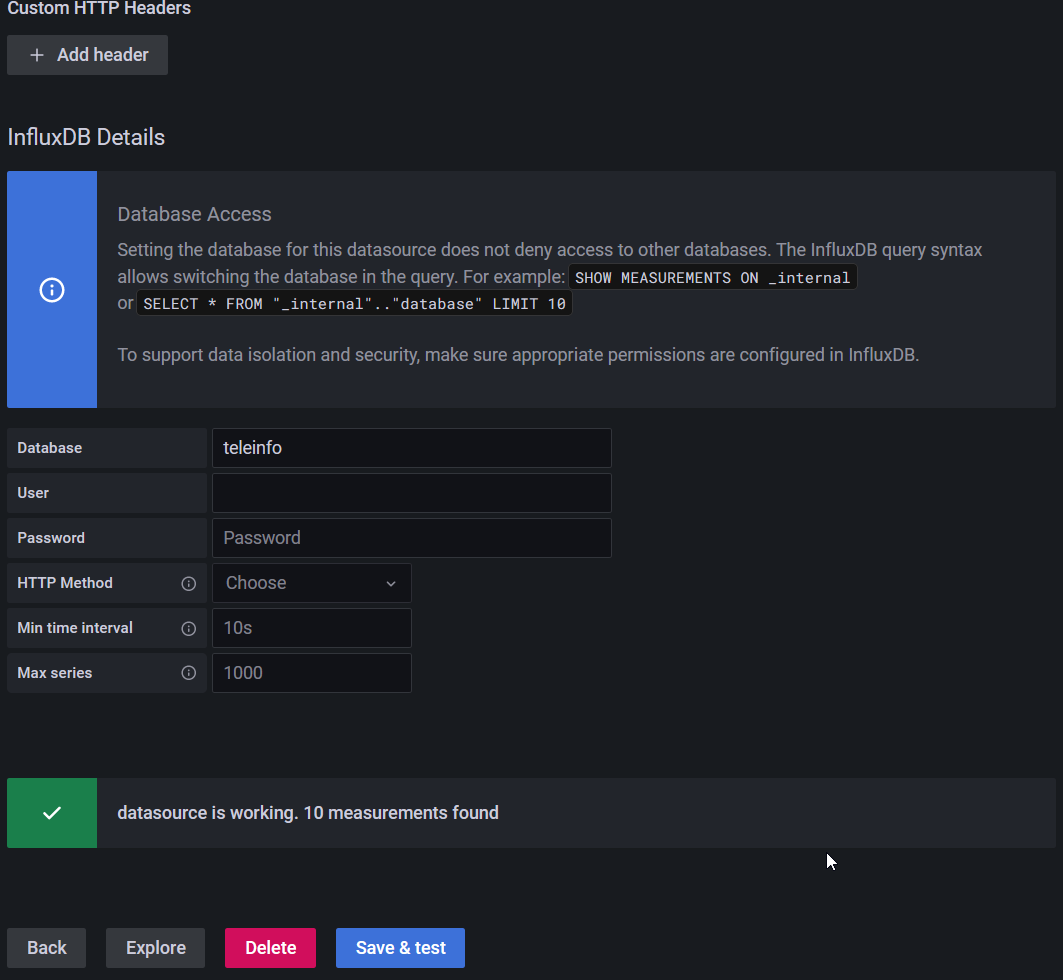
Go to Configuration -> Datasources -> Add a InfluxDB datasource.
Configure it like this:
¶ Importing Grafana dashboard
Download the .JSON file from github: https://github.com/stylersnico/teleinfo-linky-with-raspberry/blob/master/grafana_dashboard_teleinfo.json
Now, import the file in Grafana:
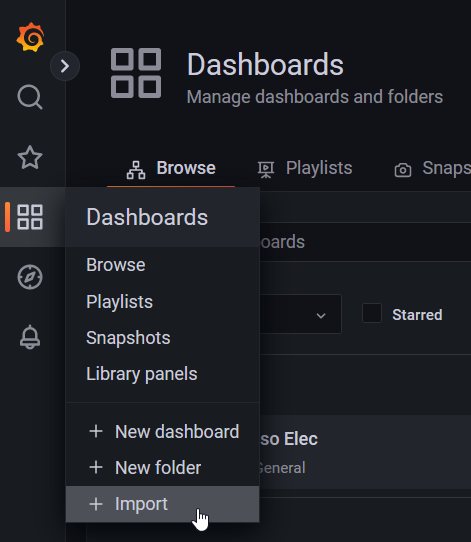
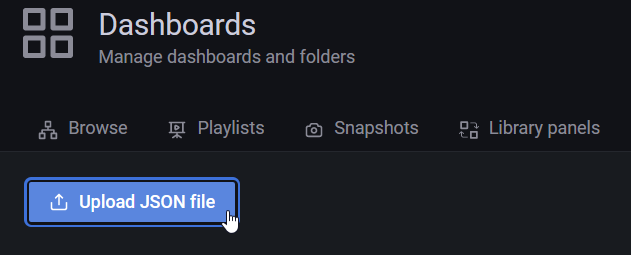
You should have the dashboard like the one you see at the beginning 
Don't forget to adapt the price calculation to your bills on the dash.