¶ Introduction
Le but de cet article est de réaliser une surveillance complète de votre compteur Linky par le biais d'un Raspberry, d'un module teleinfo et des borniers d'informations du compteur.
Dans ce cas, un Raspberry Pi 2 modèle B, toutefois la manipulation fonctionnerais sur n'importe quel Linux / BSD avec adaptation.
Cette manipulation devrait fonctionner sur n'importe quel compteur européen disposant des borniers L1 et L2 et non pas uniquement sur des Linky.
¶ Matériel nécessaire
Vous aurez besoin :
- D'un Raspberry Pi avec une carte SD de bonne qualité
- D'un module série, j'utilise ceci : https://www.tindie.com/products/hallard/micro-teleinfo-v20/
- De deux câbles cuivres (j'utilise du 1,5mm2 rigide)
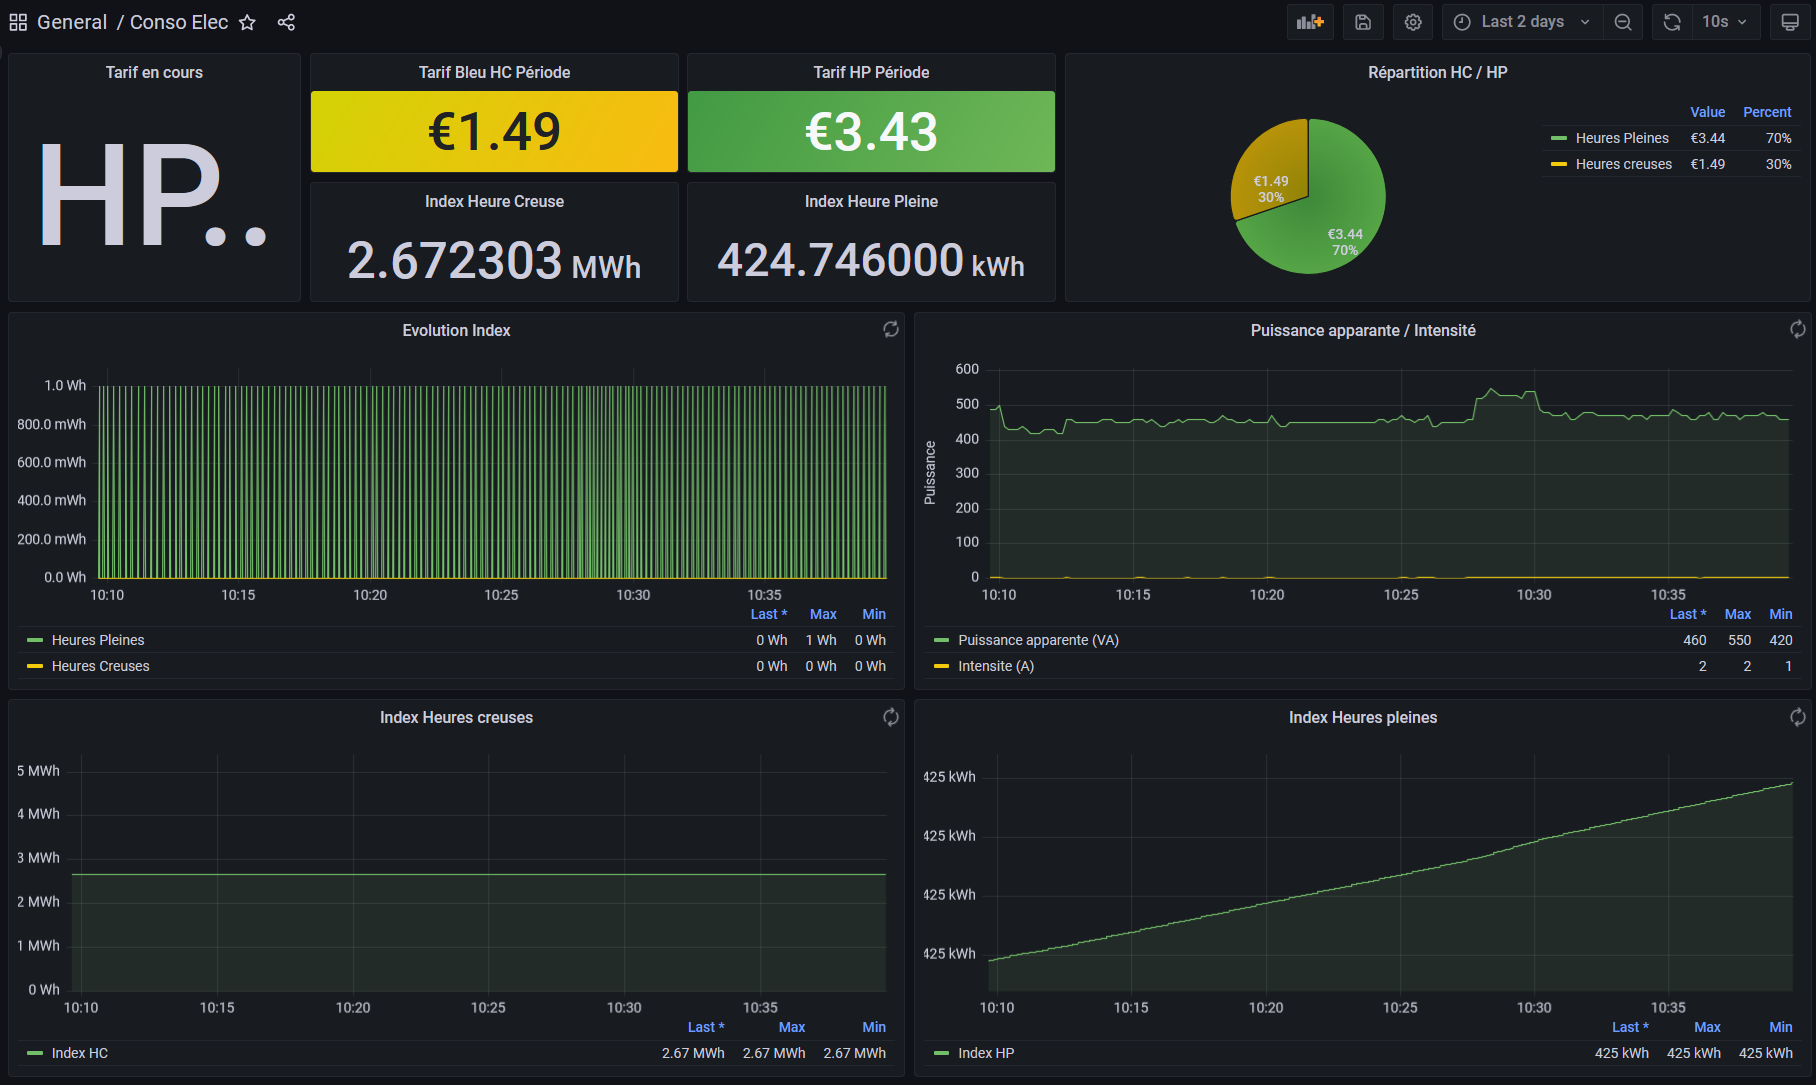
Le but est de finir avec un dashboard Grafana semblable :
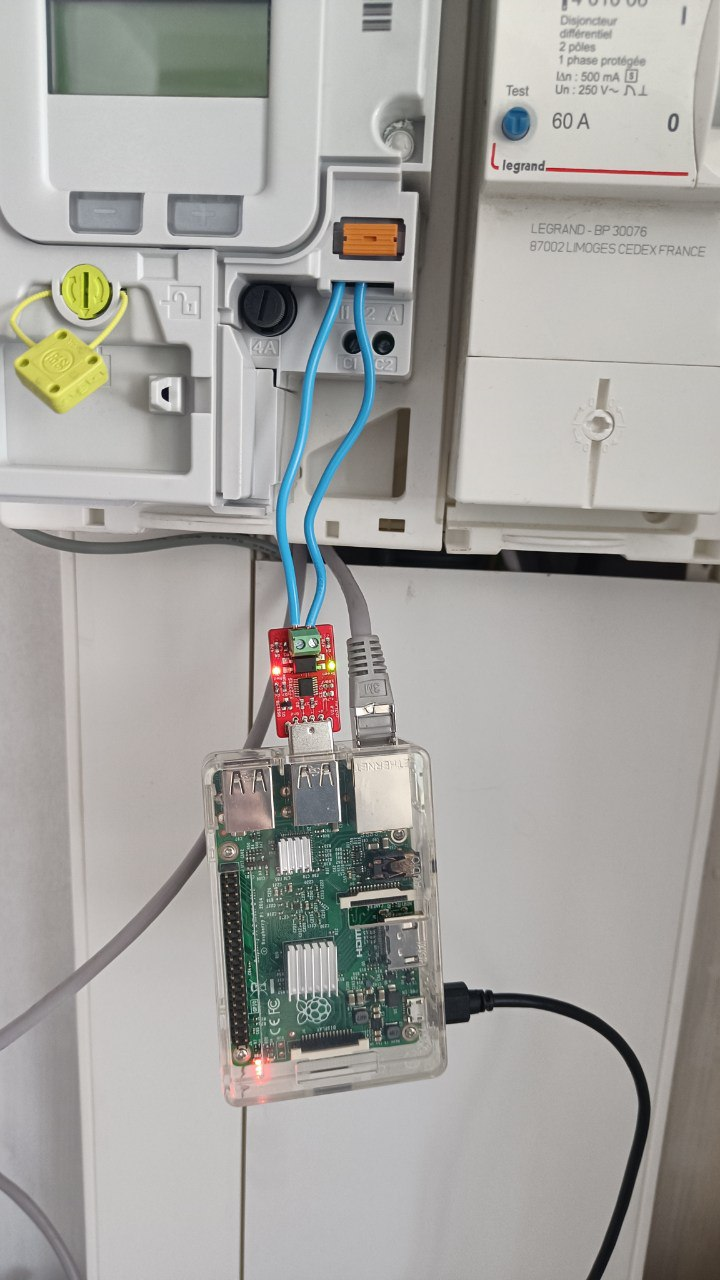
¶ Branchement
Le branchement ressemble à ceci, vous devez connecter le module sur les borniers L1 et L2 de votre Linky (l'ordre n'a pas d'importance) :
¶ Configuration du système
¶ Configuration de InfluxDB
Configurez dans un premier temps le repository de InfluxDB :
curl https://repos.influxdata.com/influxdb.key | gpg --dearmor | sudo tee /usr/share/keyrings/influxdb-archive-keyring.gpg
echo "deb https://repos.influxdata.com/debian $(lsb_release -cs) stable" > /etc/apt/sources.list.d/influxdb.list
Installez maintenant la base de données :
apt update && apt install influxdb
Activez le service au démarrage et démarrez InfluxDB :
systemctl enable influxdb && systemctl start influxdb
¶ Configuration de Grafana
Configurez dans un premier temps le repository de Grafana :
wget -q -O - https://packages.grafana.com/gpg.key | sudo apt-key add -
echo "deb https://packages.grafana.com/oss/deb stable main" > /etc/apt/sources.list.d/grafana.list
Installez maintenant Grafana :
apt update && apt install grafana
Activez le service au démarrage et démarrez Grafana :
systemctl enable grafana-server && systemctl start grafana-server
¶ Installation du script Python pour la récupération des données
Testez d'abord votre connexion série avec la commande suivante (Vous pouvez quitter avec CTRL+A suivi de CTRL+Q) :
picocom -b 1200 -d 7 -p e -f n /dev/ttyUSB0
Vous devriez avoir une sortie semblable :
root@enedis-pi:~# picocom -b 1200 -d 7 -p e -f n /dev/ttyUSB0
picocom v3.1

port is        : /dev/ttyUSB0
flowcontrol    : none
baudrate is    : 1200
parity is      : even
databits are   : 7
stopbits are   : 1
escape is      : C-a
local echo is  : no
noinit is      : no
noreset is     : no
hangup is      : no
nolock is      : no
send_cmd is    : sz -vv
receive_cmd is : rz -vv -E
imap is        :
omap is        :
emap is        : crcrlf,delbs,
logfile is     : none
initstring     : none
exit_after is  : not set
exit is        : no

Type [C-a] [C-h] to see available commands
Terminal ready
0440 )
HHPHC A ,
TDETAT 000000 B
  ADCO 812164547605 H
OPTARIF HC.. <
ISOUSC 45 ?
HCHC 002669308 (
HCHP 000418037 *
PTEC HP..
IINST 001 X
IMAX 090 H
PAPP 00440 )
HHPHC A ,
TDETAT 000000 B
  ADCO 812164547605 H
OPTARIF HC.. <
ISOUSC 45 ?
HCHC 002669308 (
HCHP 000418037 *
PTEC HP..
IINST 001 X
IMAX 090 H
PAPP 00440 )
HHPHC A ,
TDETAT 000000 B
  ADCO 812164547605 H
OPTARIF
Terminating...
Skipping tty reset...
Thanks for using picocom
Installez les pré-requis :
apt install python3-pip
pip3 install pySerial influxdb
Ou sur les dernières Debian 13 :
apt installpython3-serial python3-influxdb
Téléchargez et lancez le script pour le tester :
wget https://raw.githubusercontent.com/stylersnico/teleinfo-linky-with-raspberry/master/teleinfo.py
python3 teleinfo.py
Si vous n'avez pas d'erreur au bout de 5 minutes, quittez le script avec un CTRL+C
¶ Vérification des données
Lancez InfluxDB afin de vérifier la présence des données :
influx
Connectez-vous à la base teleinfo et affichez les différentes séries :
USE teleinfo
SHOW SERIES;
Vous devriez avoir la sortie suivante :
Connected to http://localhost:8086 version 1.8.10
InfluxDB shell version: 1.8.10
> USE teleinfo
Using database teleinfo
> SHOW SERIES;
key
---
HCHC,host=raspberry,region=linky
HCHP,host=raspberry,region=linky
HHPHC,host=raspberry,region=linky
IINST,host=raspberry,region=linky
IMAX,host=raspberry,region=linky
ISOUSC,host=raspberry,region=linky
MOTDETAT,host=raspberry,region=linky
OPTARIF,host=raspberry,region=linky
PAPP,host=raspberry,region=linky
PTEC,host=raspberry,region=linky
> exit
root@enedis-pi:~#
¶ Création du service
Créez le service suivant :
nano /etc/systemd/system/teleinfo.service
Remplissez le avec ceci :
[Unit]
Description = Run teleinfo python script
After = network.target

[Service]
Type = simple
ExecStart = python /root/teleinfo.py
User = root
Group = root
Restart = on-failure
SyslogIdentifier = teleinfo
RestartSec = 5
TimeoutStartSec = infinity

[Install]
WantedBy = multi-user.target
Lancez maintenant le service :
touch /var/log/teleinfo/releve.log
systemctl daemon-reload
systemctl enable teleinfo.service && systemctl start teleinfo.service
¶ Configuration de l'affichage
¶ Configuration de la source InfluxDB dans Grafana
Ouvrez Grafana depuis l'adresse suivante :
http://IP_RASPBERRY:3000
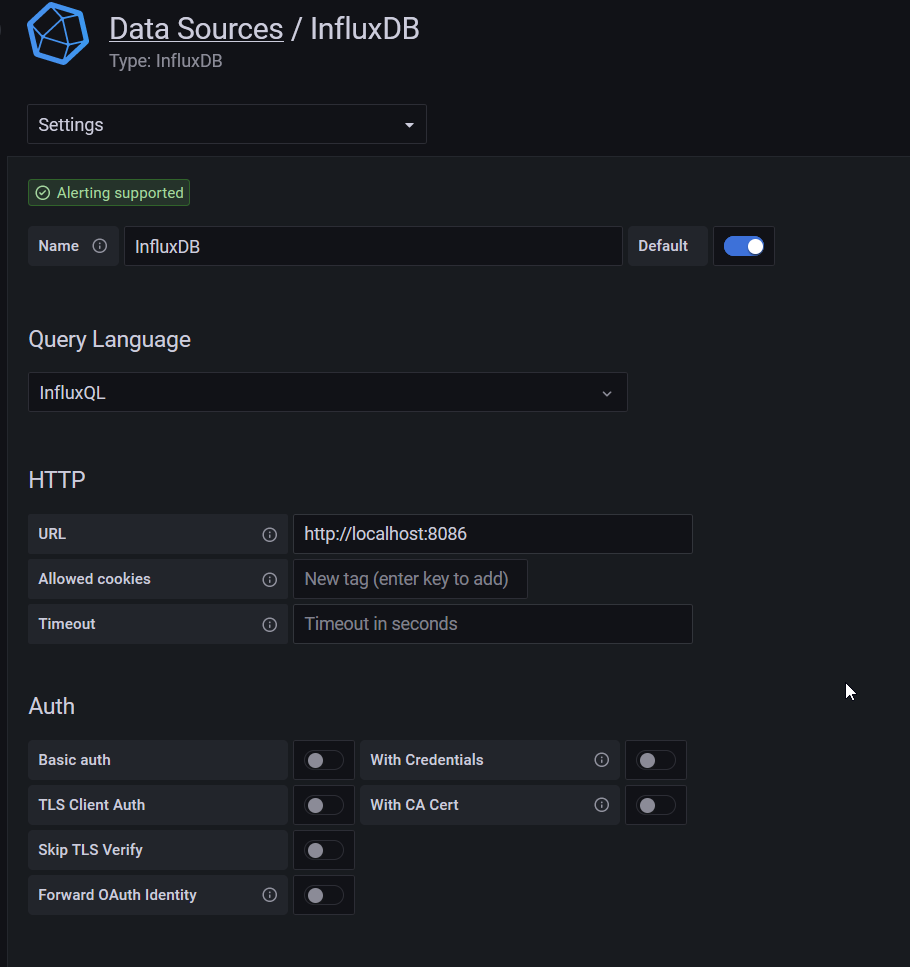
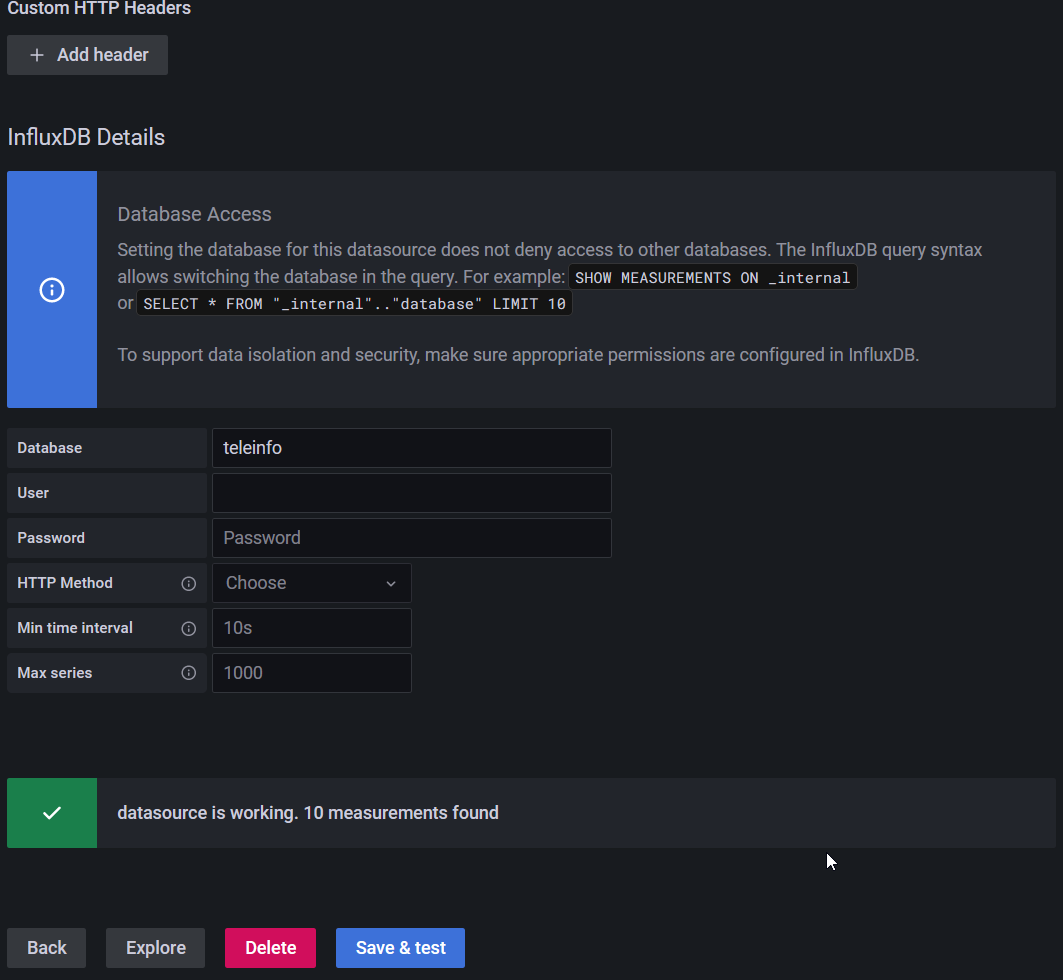
Allez dans Configuration -> Datasources -> Ajoutez une source InfluxDB.
Configurez la source comme ceci :
¶ Importation du Dashboard Grafana
Téléchargez le fichier .JSON depuis Github : https://github.com/stylersnico/teleinfo-linky-with-raspberry/blob/master/grafana_dashboard_teleinfo.json
Maintenant, importez le dashboard avec ce fichier directement depuis Grafana :
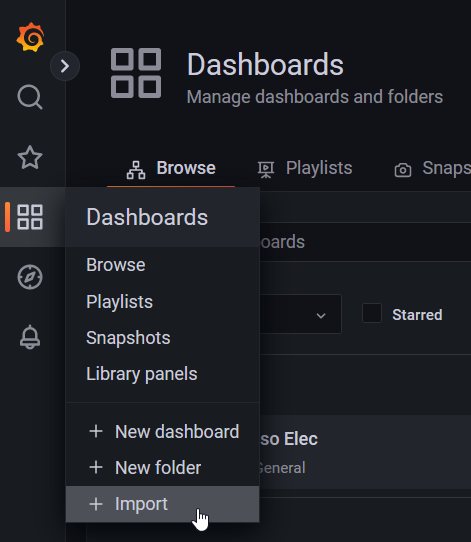
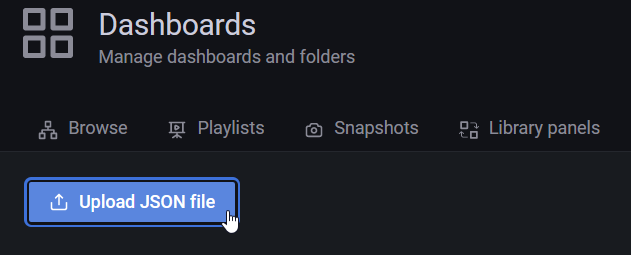
Vous devriez maintenant voir le dashboard comme celui au début 
N'oubliez pas d'adapter les tarifs dans le calcul des prix.